


- Institutional Effectiveness
- Data Visualizations and Infographics


Data Visualizations and Infographics
Below you will find links to interactive data visualizations and infographics that will help you learn more, at a glance, about SNC students, faculty and academic programs.
Explore a topic of interest and contact our office to obtain information about these existing data resources or to request additional data visualizations or infographics.
For clarity on definitions of key student data terms, and the college's use of this data, please click here for more information.
Interactive Dashboards
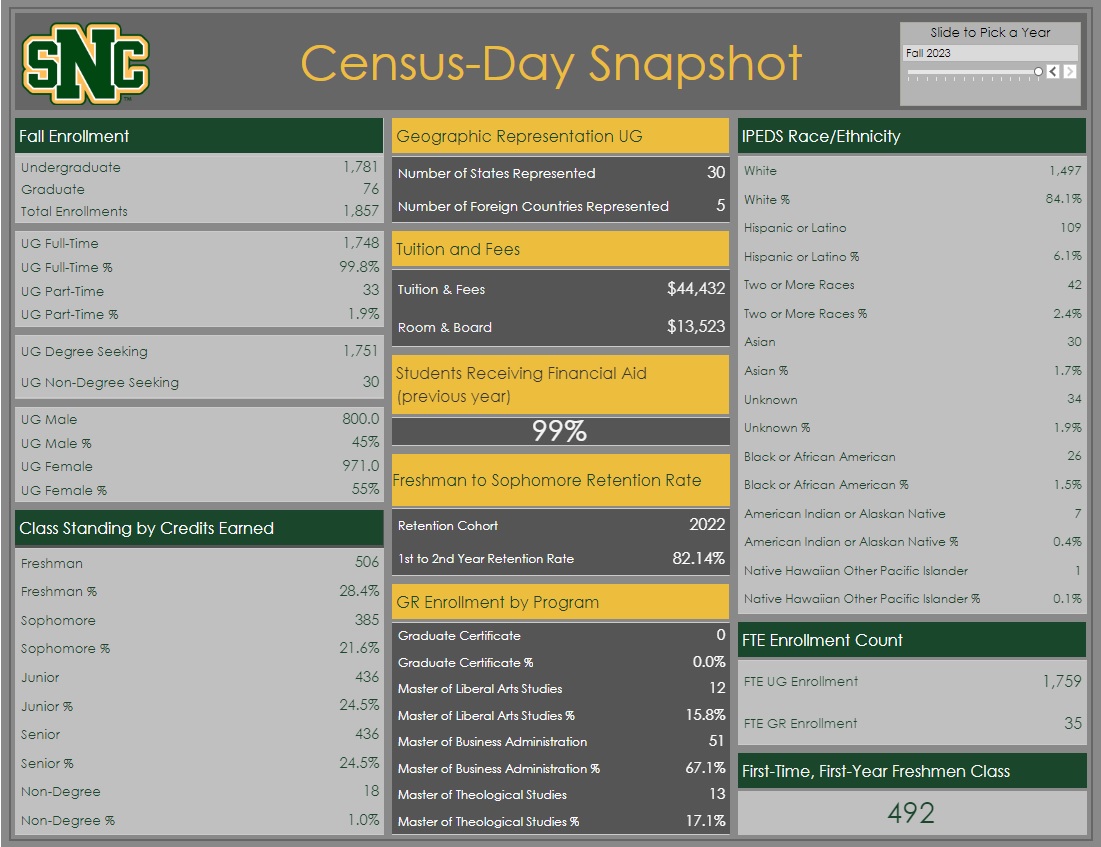 |
Census Day Snapshot
Provides aggregate student information as of census day for current and previous academic years. |
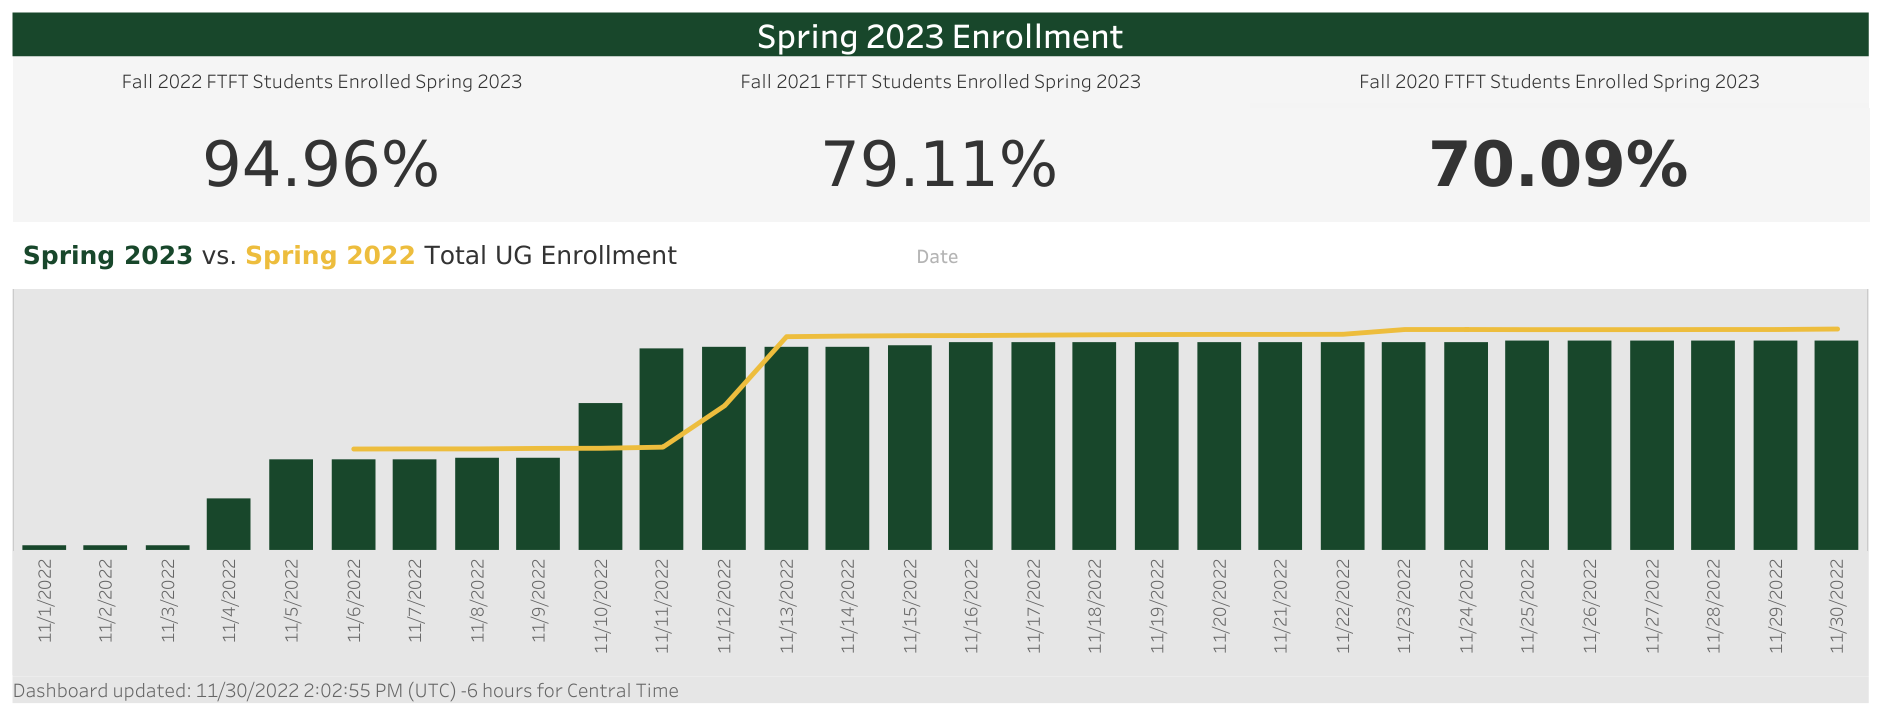 |
Enrollment and Retention
Provides information about enrollment and retention trends over time. |
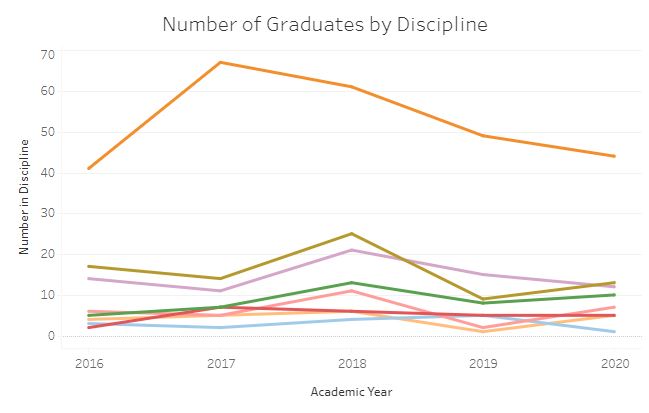 |
Number of Graduates Provides information about graduates of each major program, by year and trend over time, expressed both in terms of actual number and as a percentage of graduates of the division and the college as a whole |
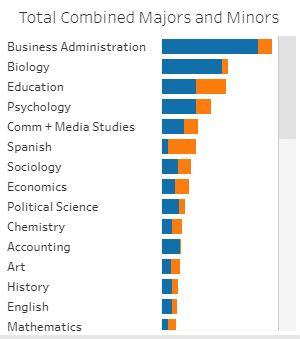 |
Number of Majors/Minors Provides information about numbers of majors and minors for each academic program, by year and trend over time |
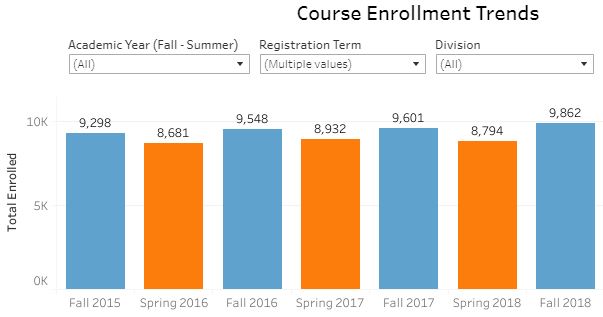 |
Course Enrollment Trends Provides information about course enrollments, by year and by term, for each division and discipline |
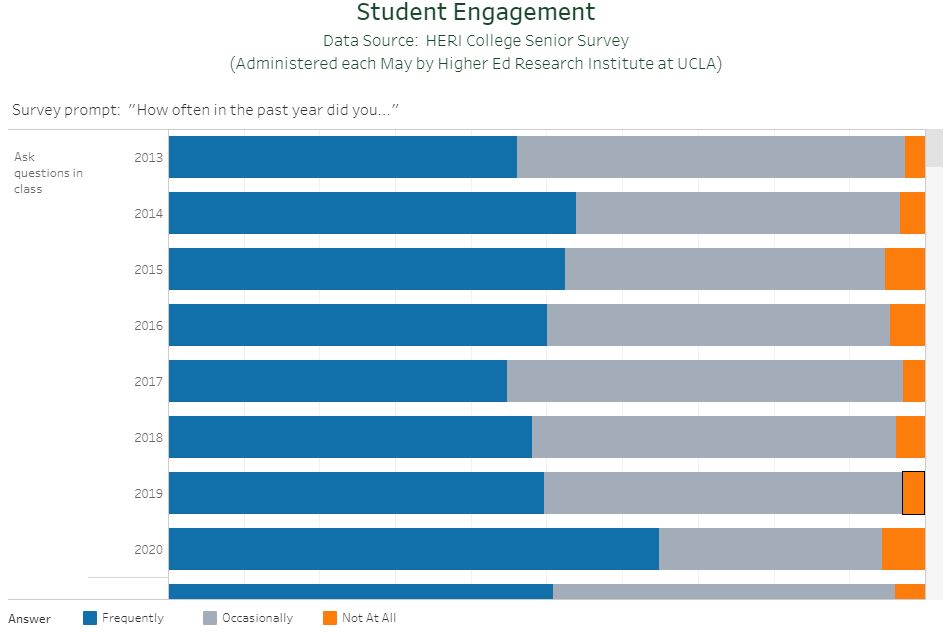 |
Student Engagement and Experience Provides information about the extent to which students, by |
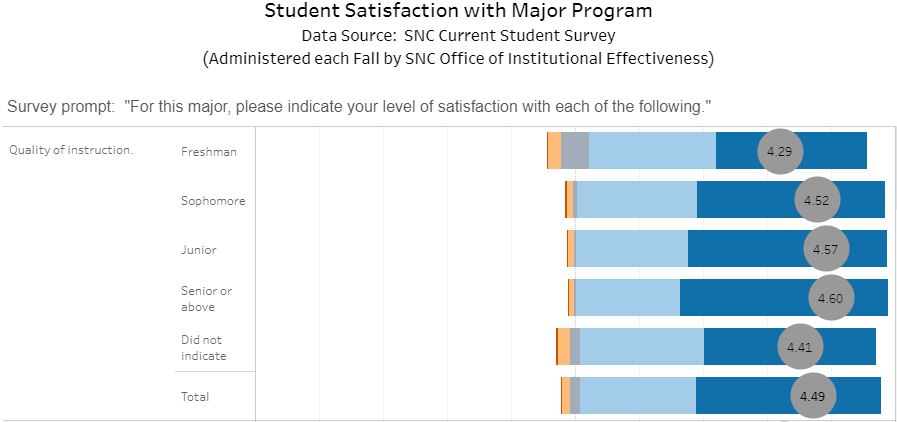 |
Student Satisfaction Provides information about student satisfaction with various aspects of each academic program, for current students, graduating seniors and alumni. |
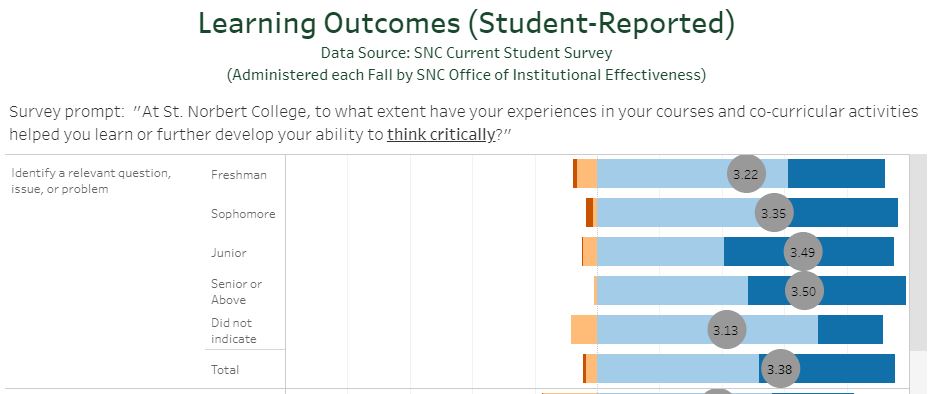 |
Student (Self-Reported) Learning Outcomes Provides information about the extent to which students, by |
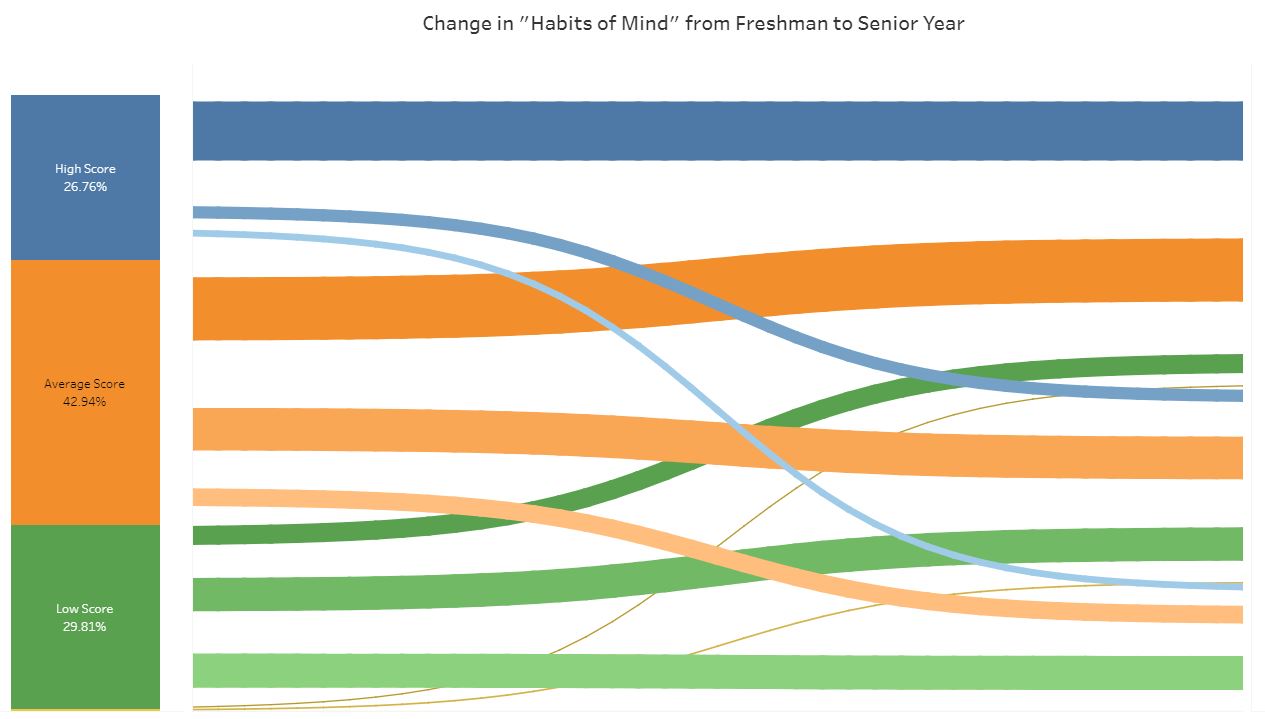 |
Longitudinal Changes from First-Year to Senior Year This visualization is fascinating but requires a bit more work to digest! It provides a longitudinal look at students who completed both the HERI Freshman and the HERI Senior survey, and shows changes in their “Habits of Mind,” “Academic Self-Concept,” “Social Agency,” and “Social Self-Concept”. |
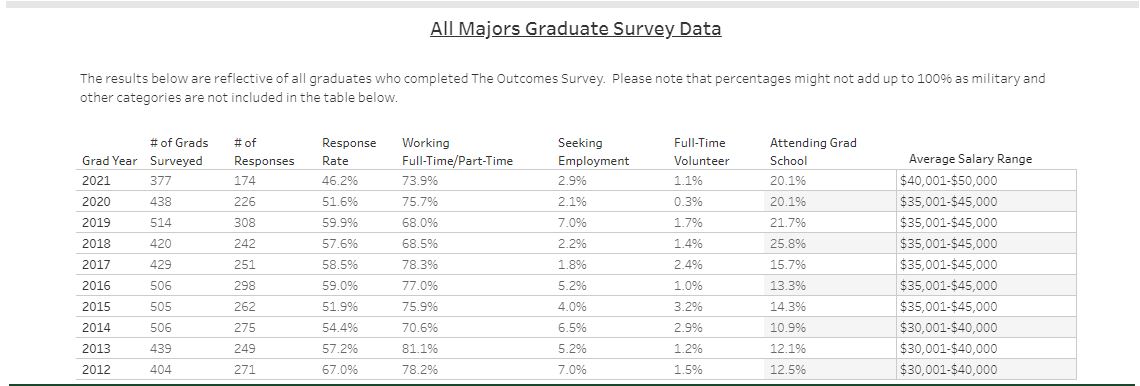 |
New Graduates' First Destinations Provides information regarding the first destinations of graduating seniors, whether employment, further education, or voluntary service. For those employed, includes name and location of employer, job title, and average salary range. For those pursuing further education, includes name of graduate institution and program. |
Infographics
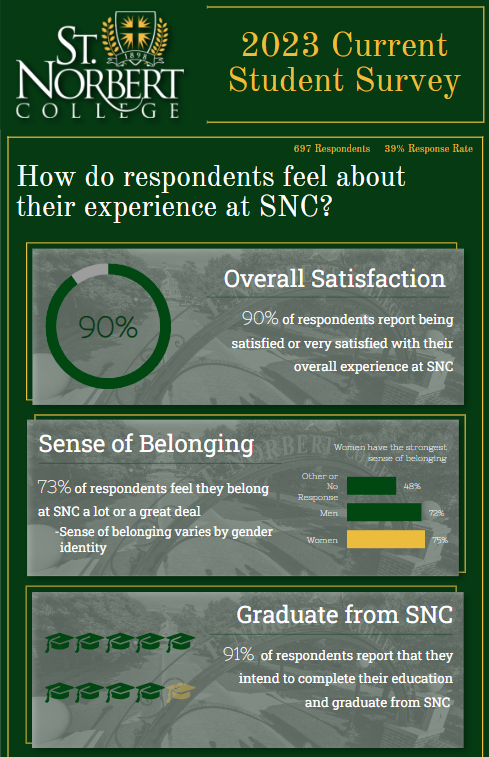 |
2023 Current Student Survey |
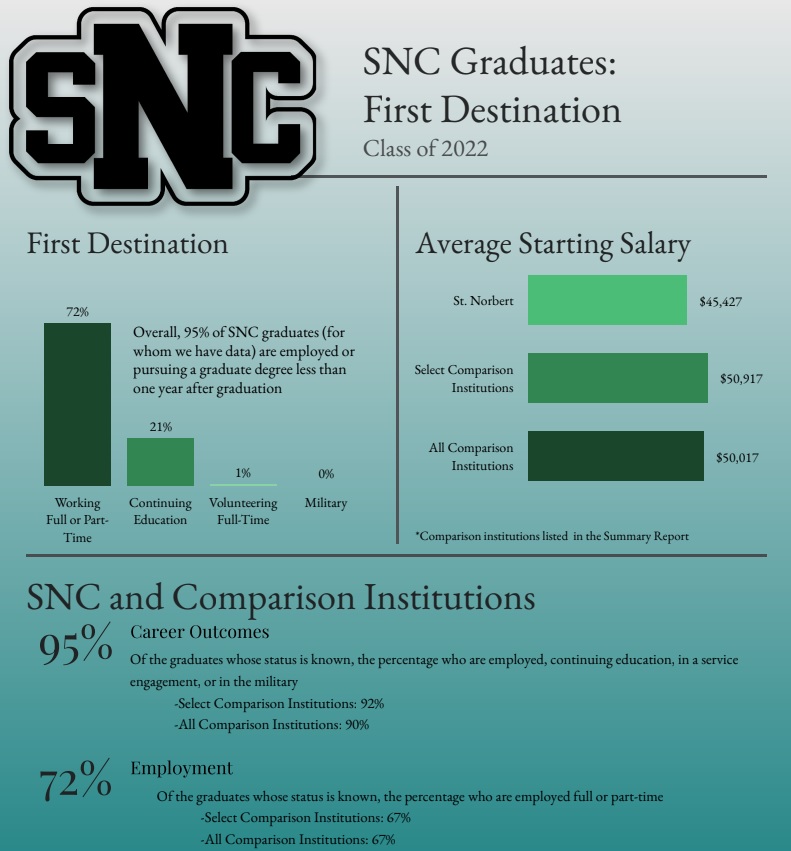 |
Class of 2022: First Destination Survey |
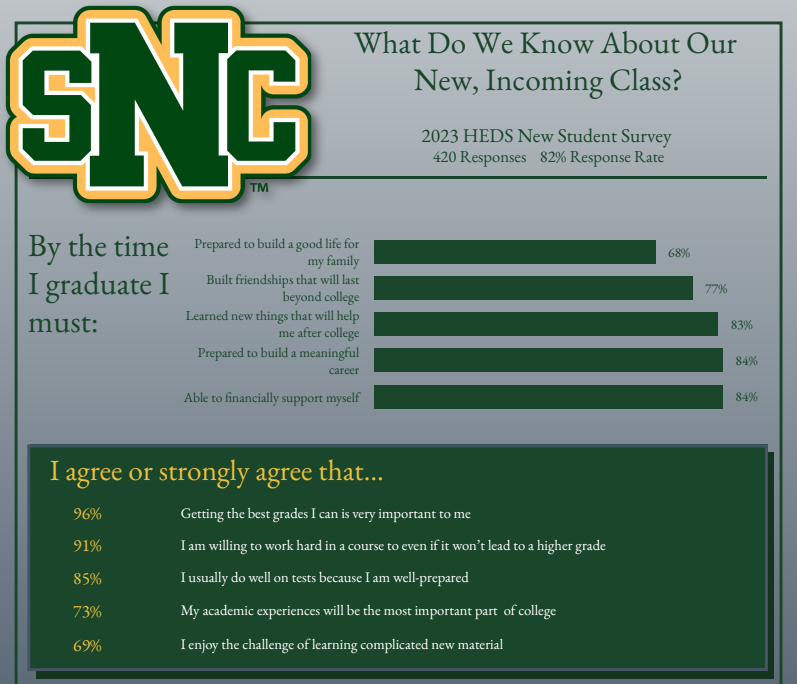 |
2023 HEDS New Student Survey |
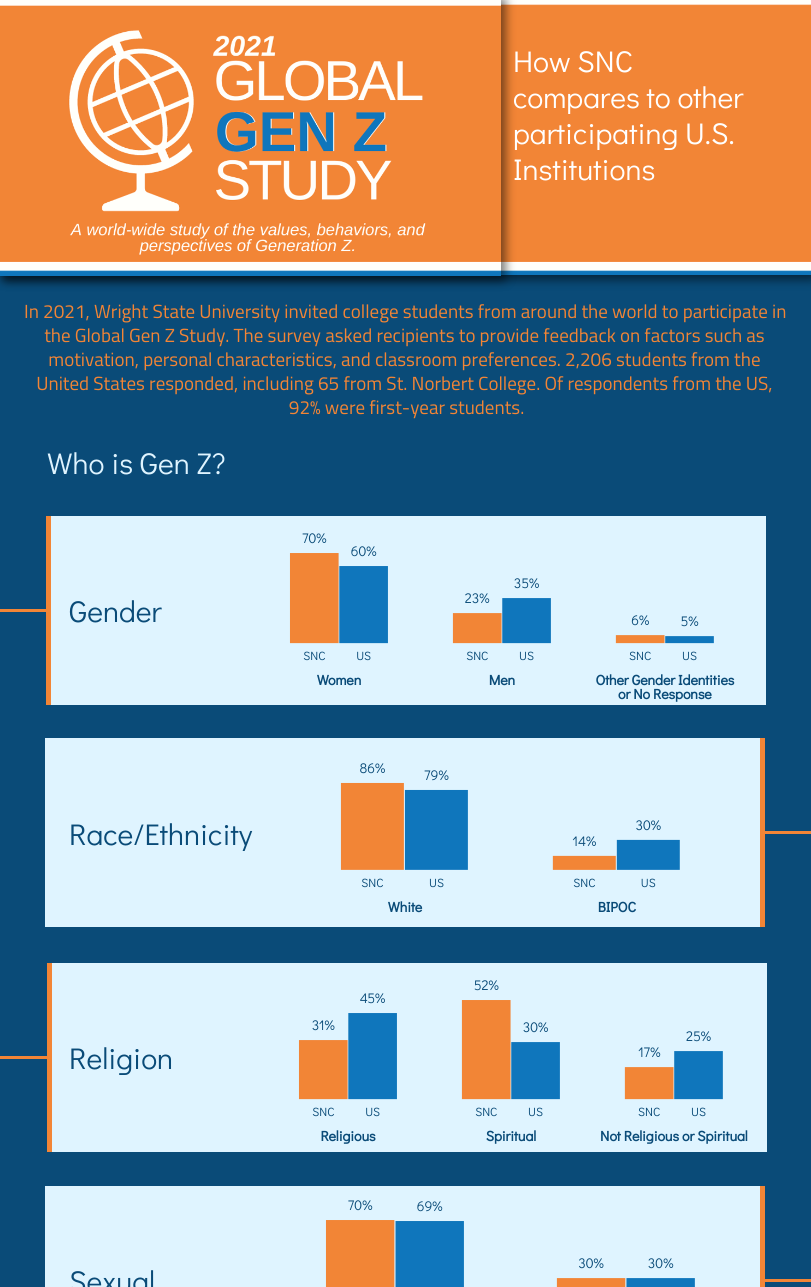 |
2021 Global Gen Z Study |
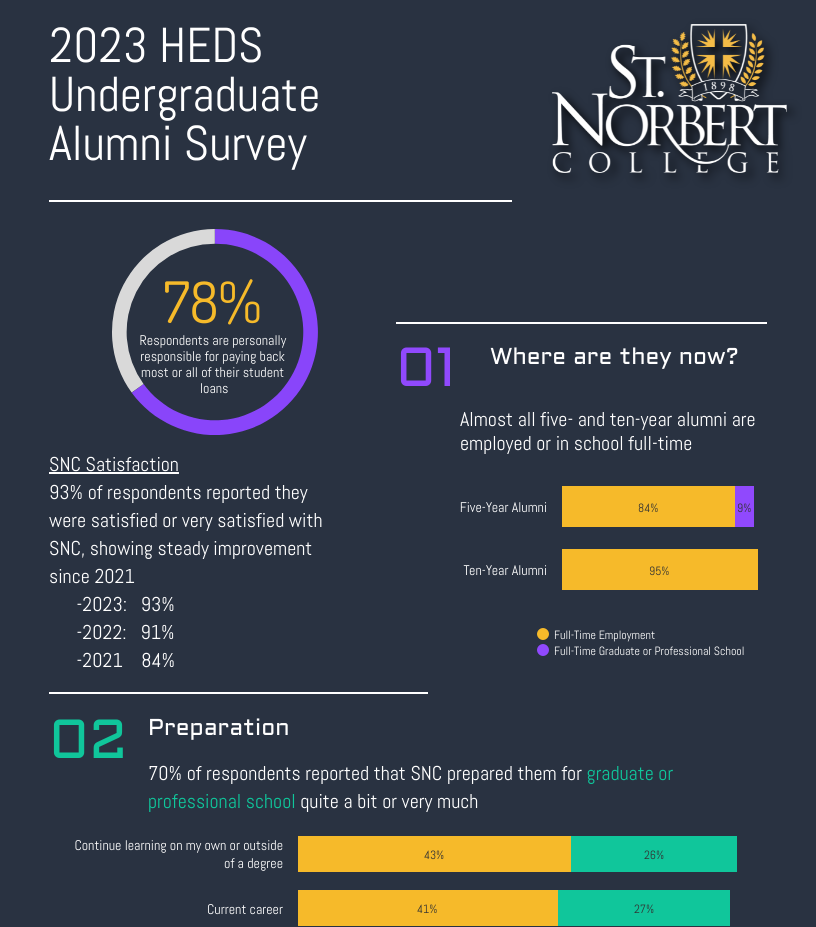 |
2023 HEDS Undergraduate Alumni Survey |
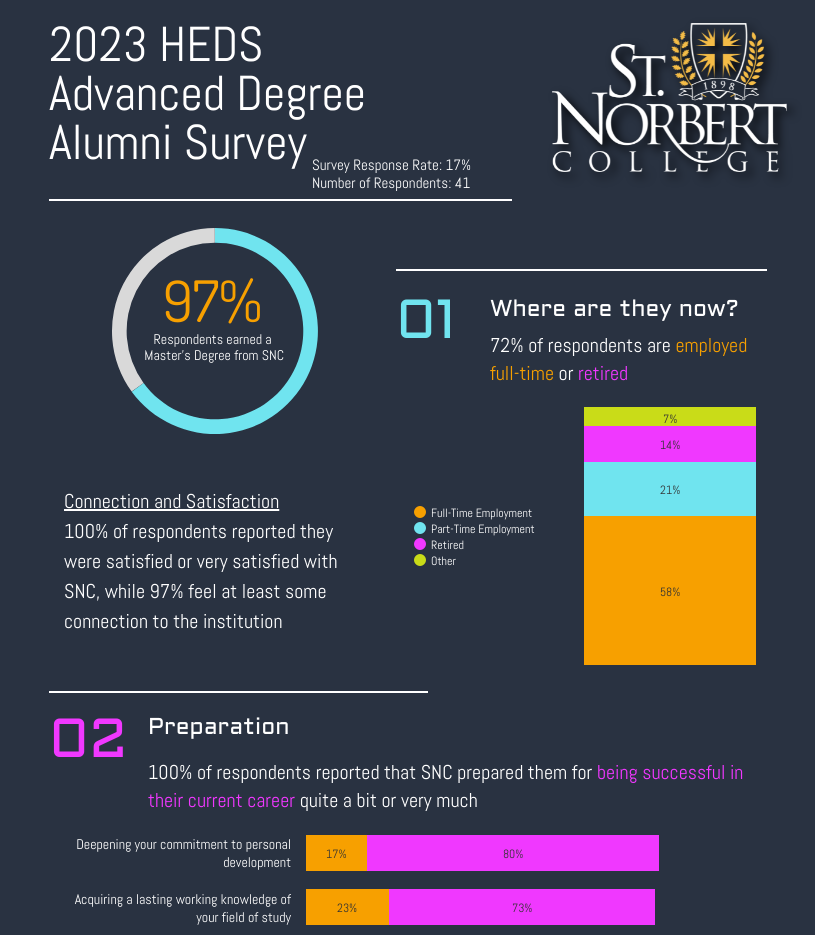 |
2023 HEDS Advanced Degree Alumni Survey |
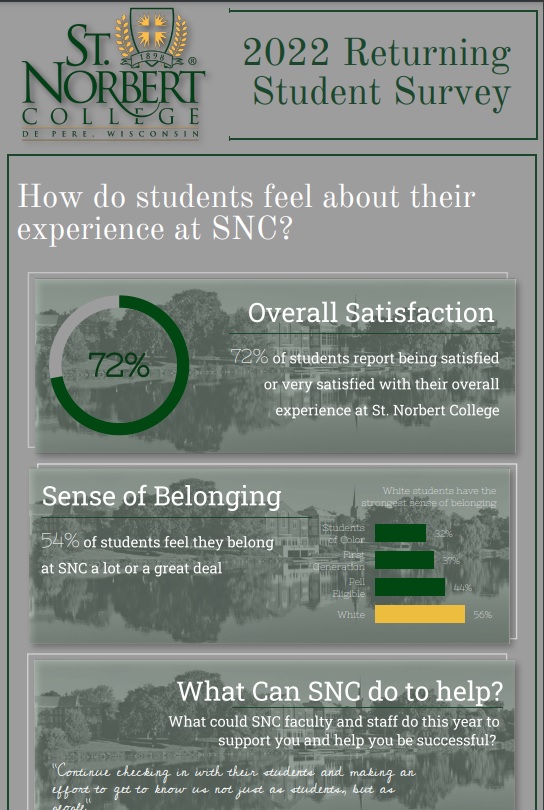 |
2022 Returning Student Survey |
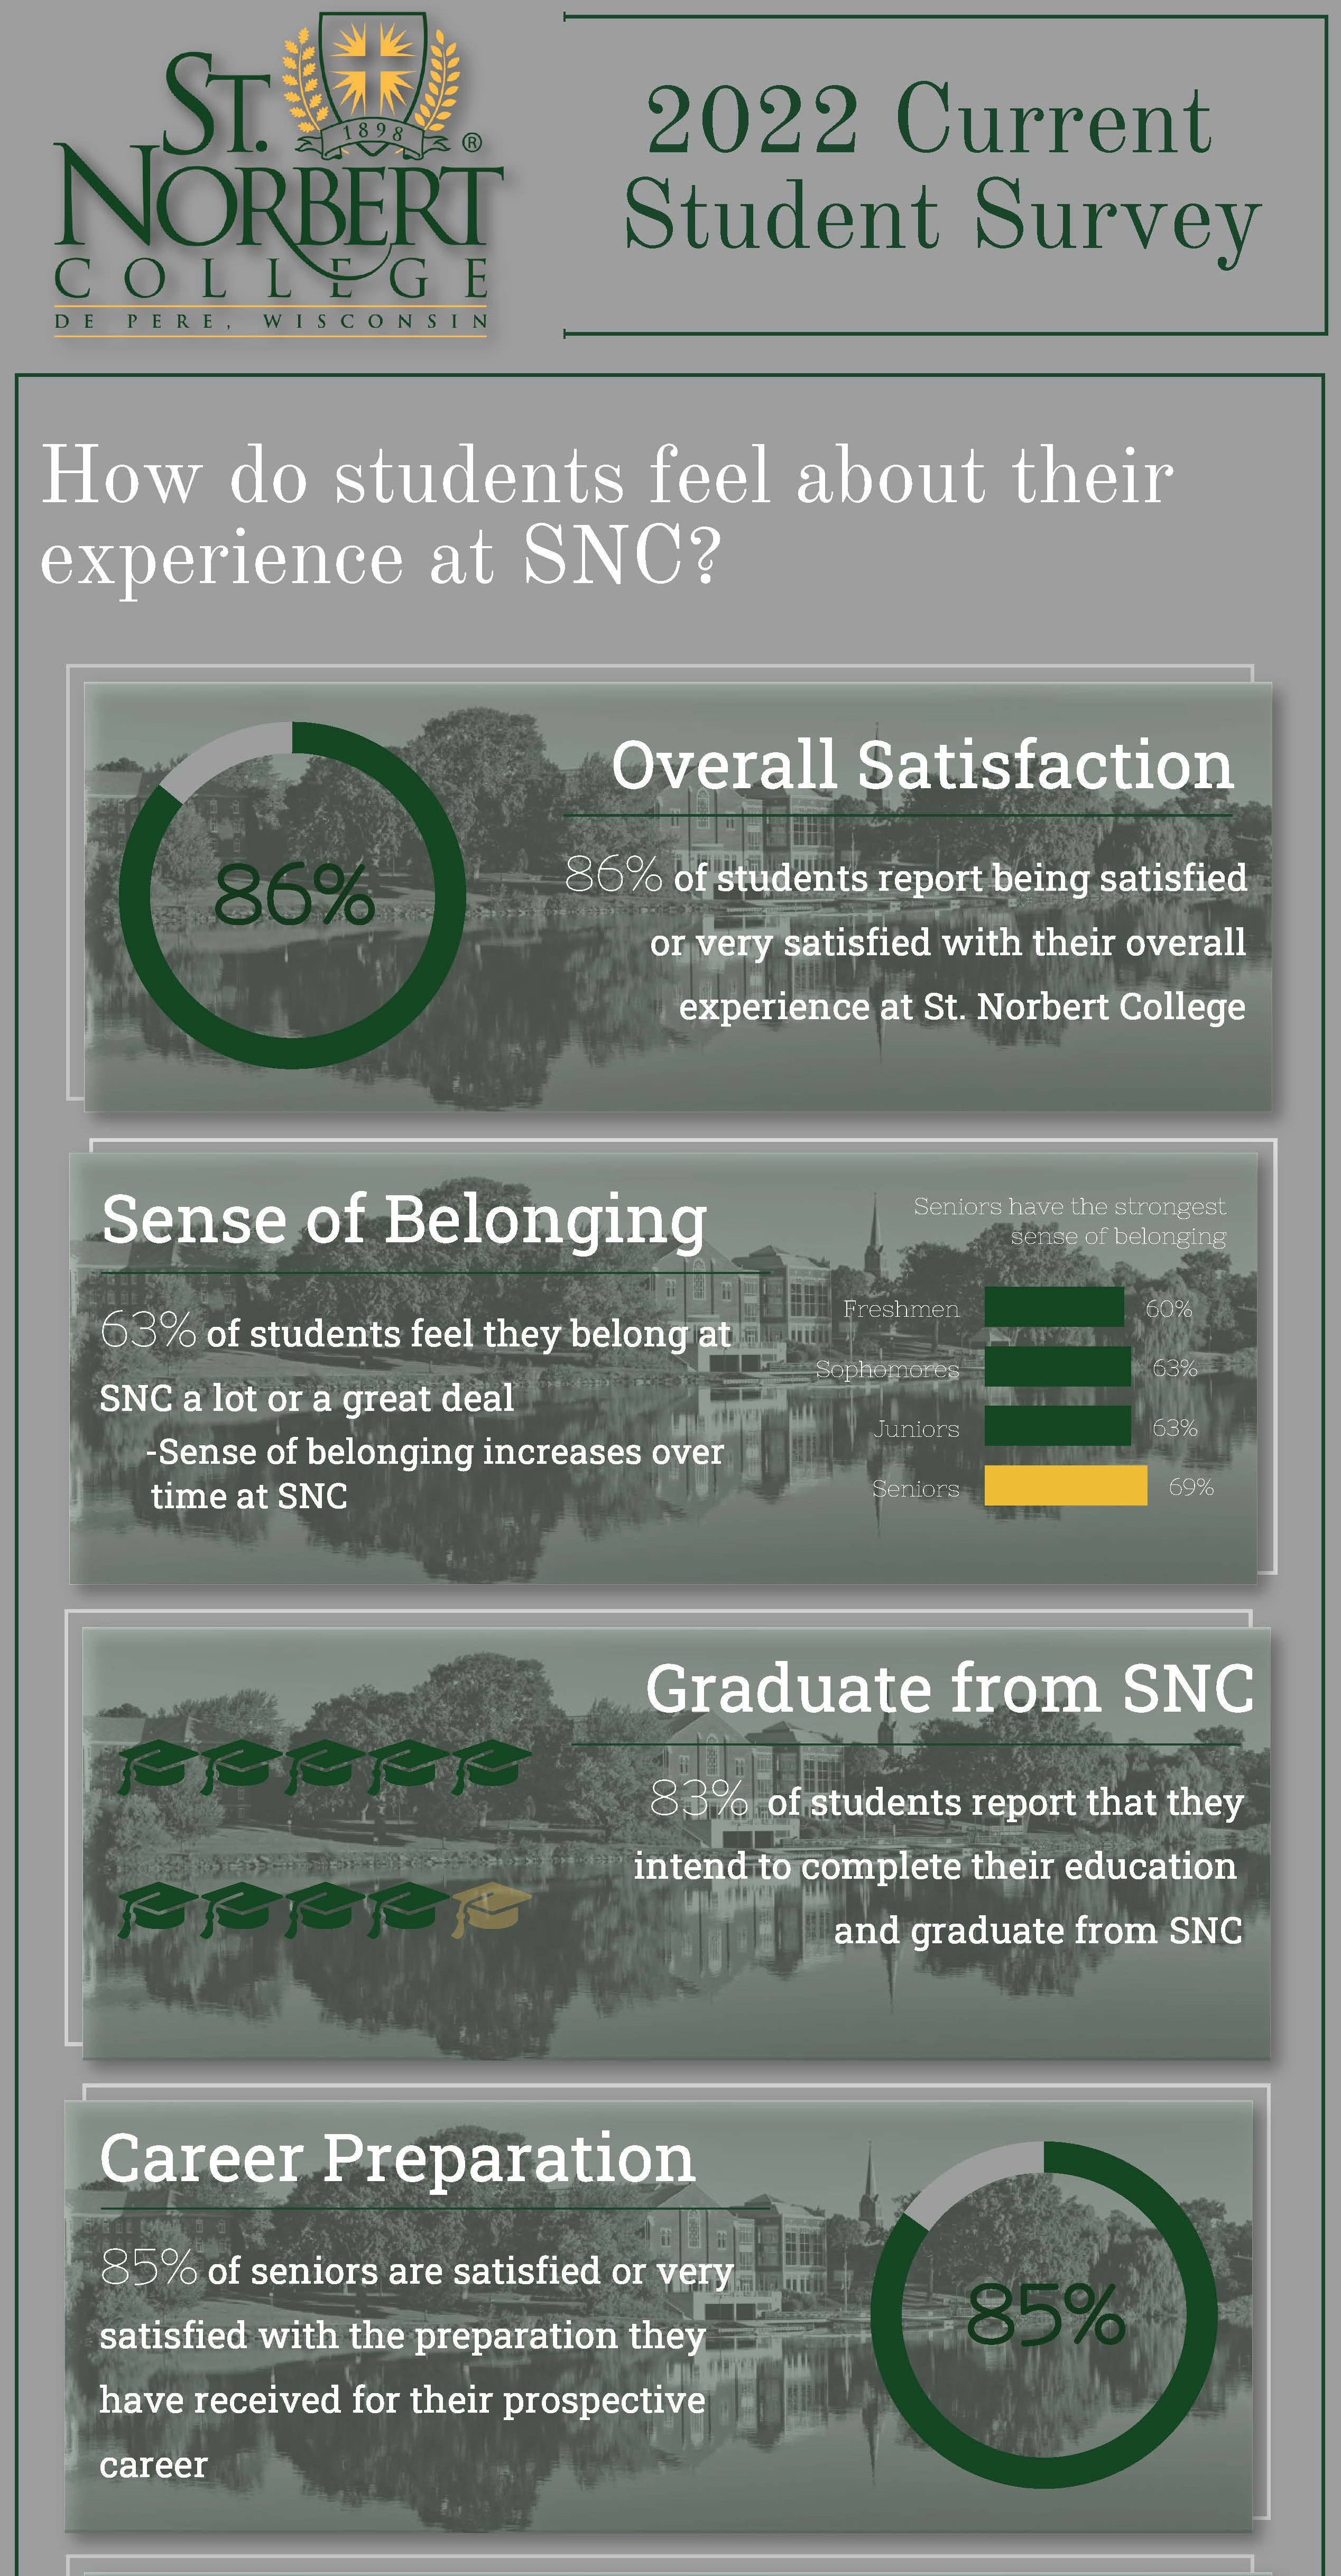 |
2022 Current Student Survey |
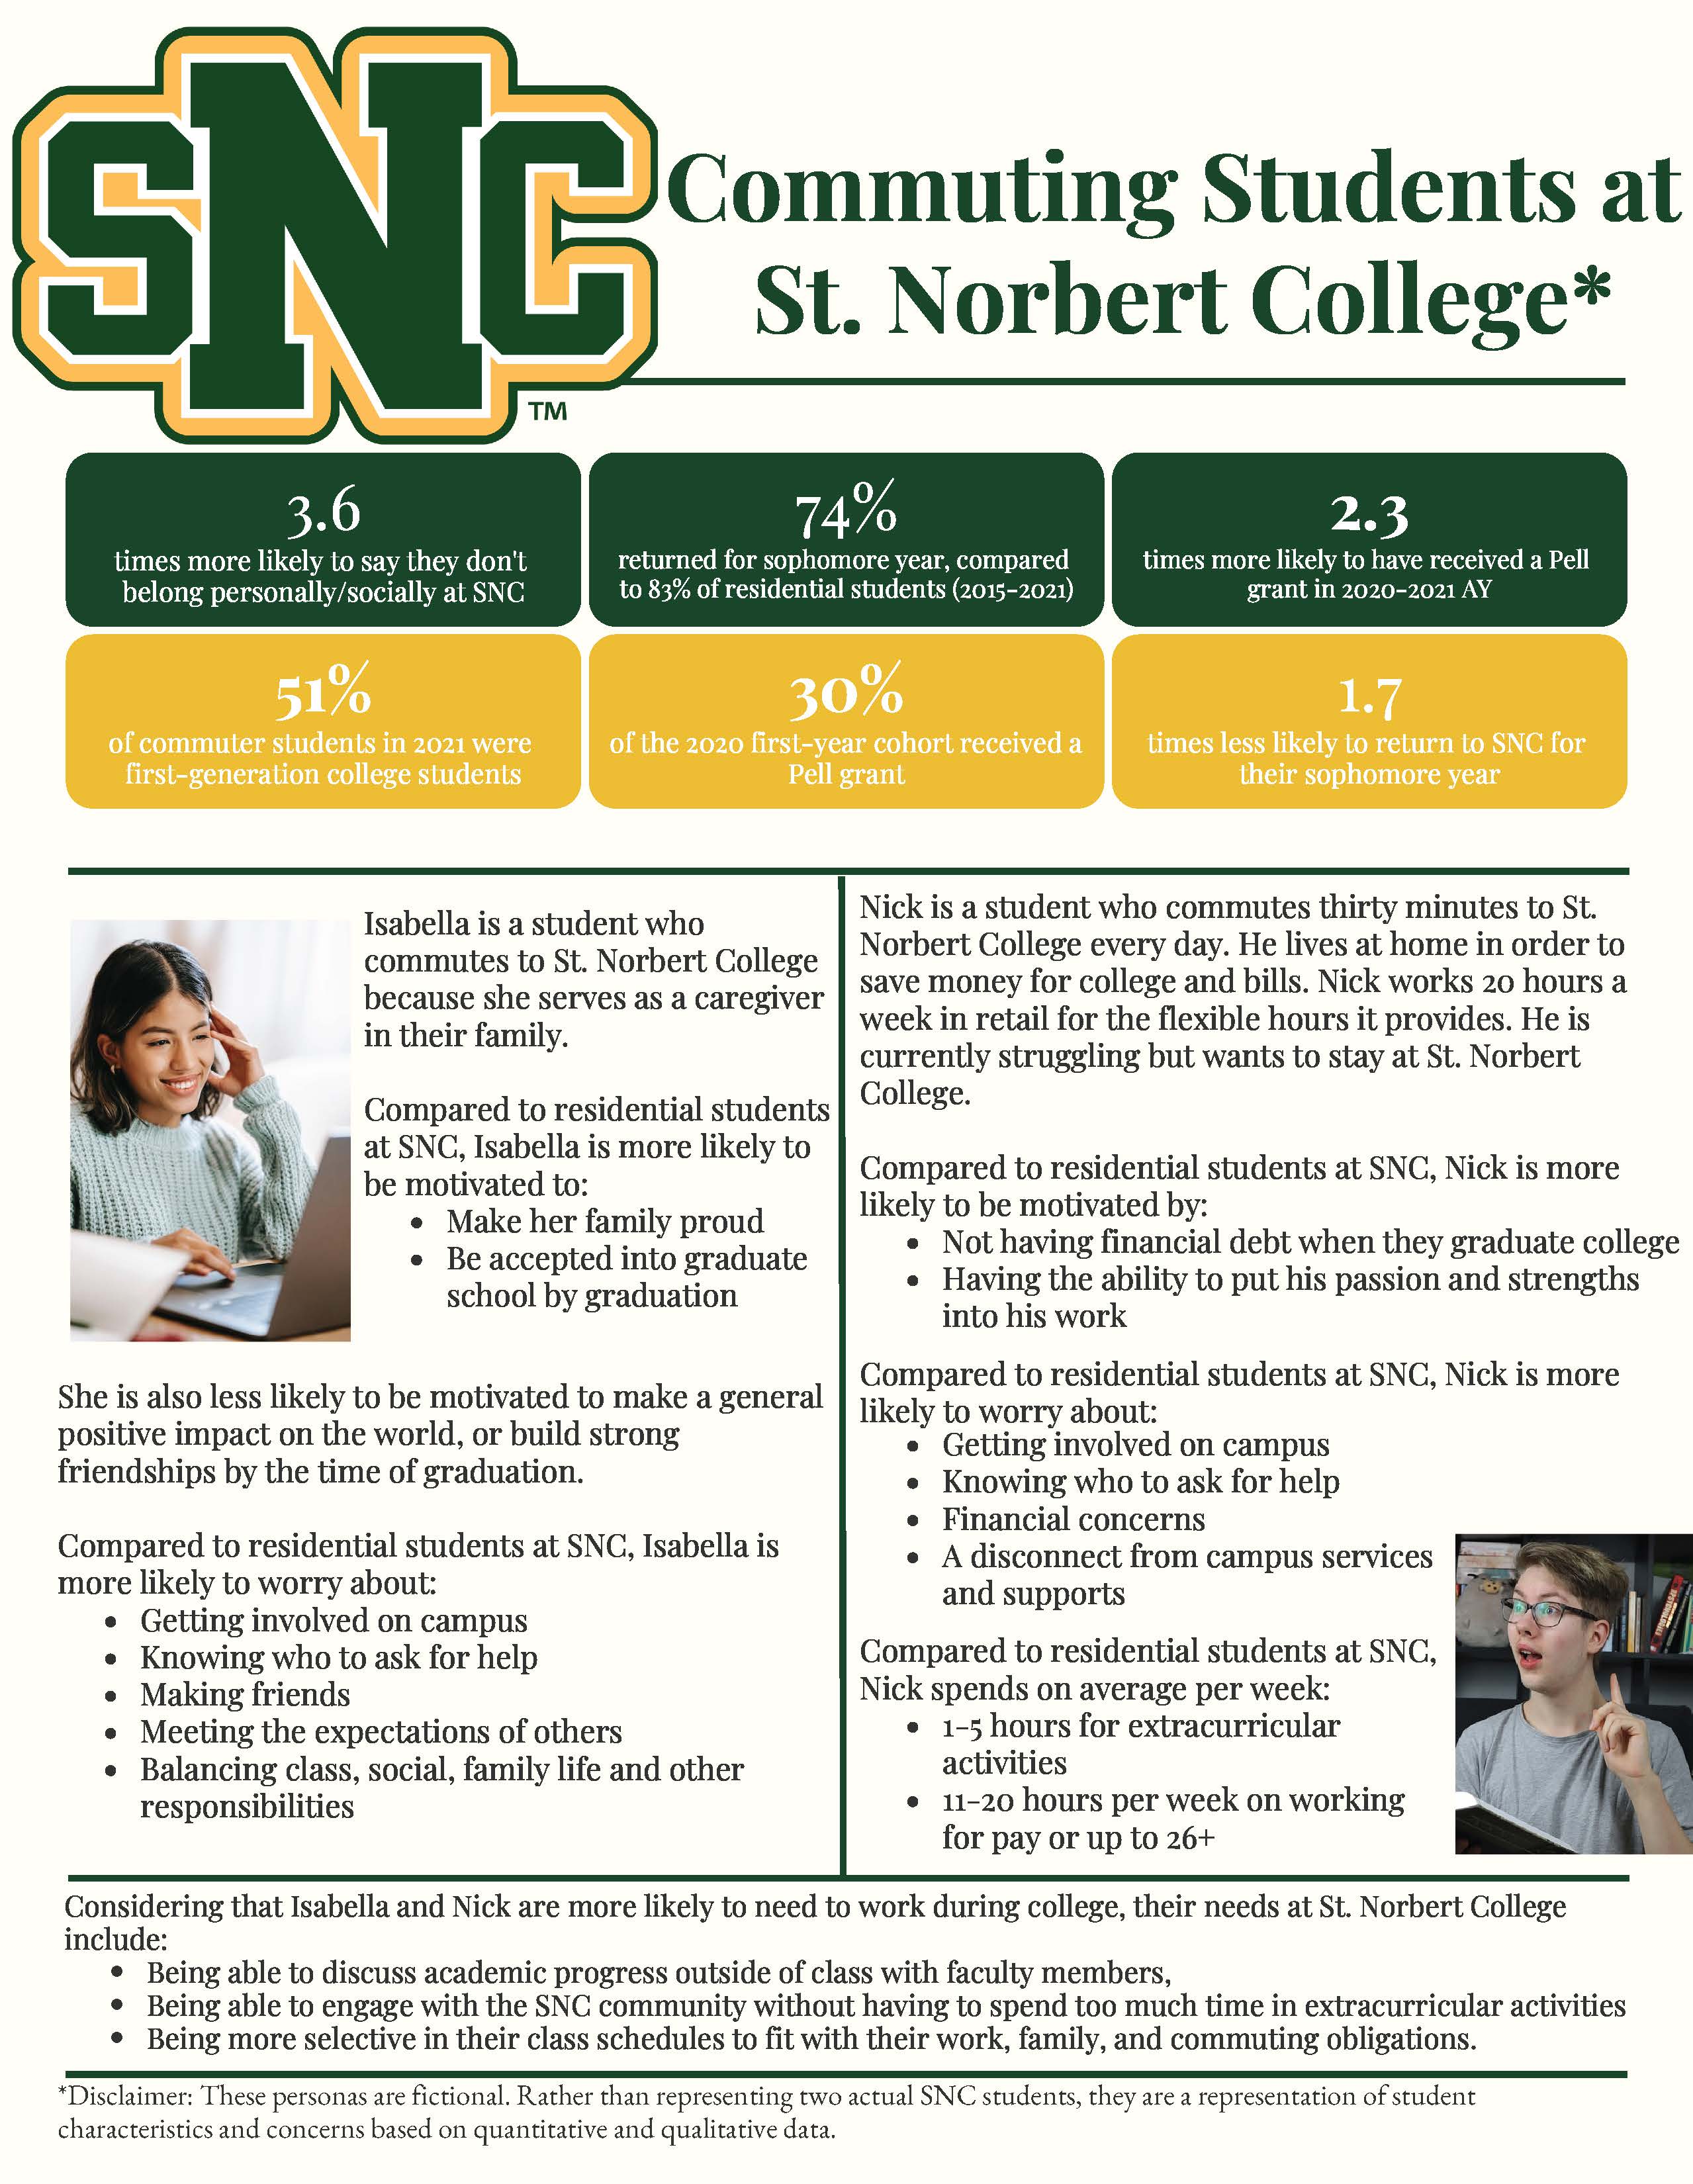 |
Commuting Students at St. Norbert College |
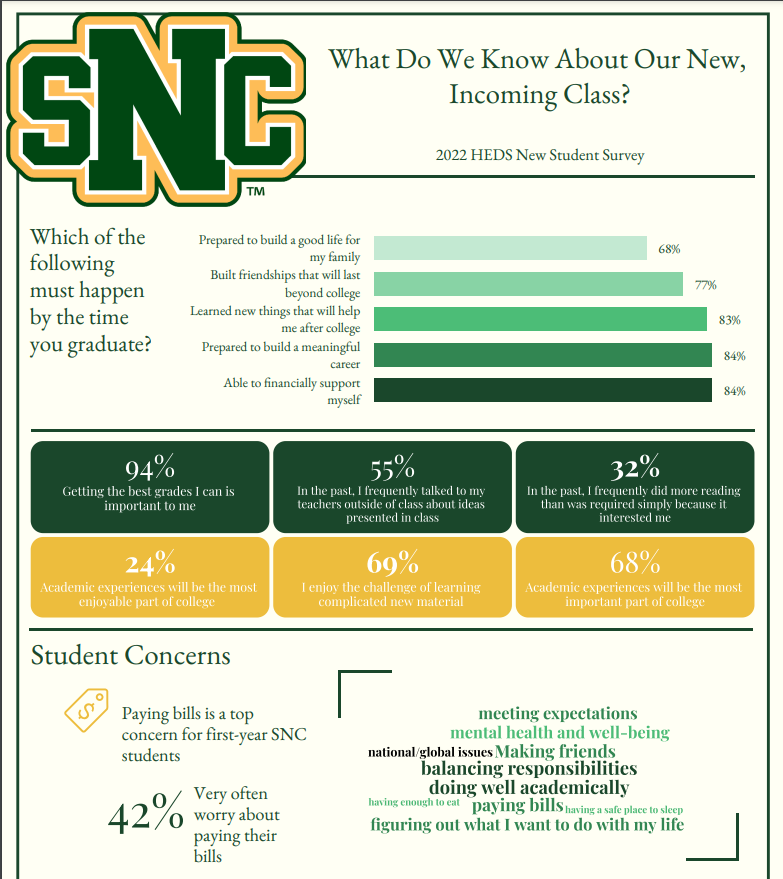 |
2022 HEDS New Student Survey
|
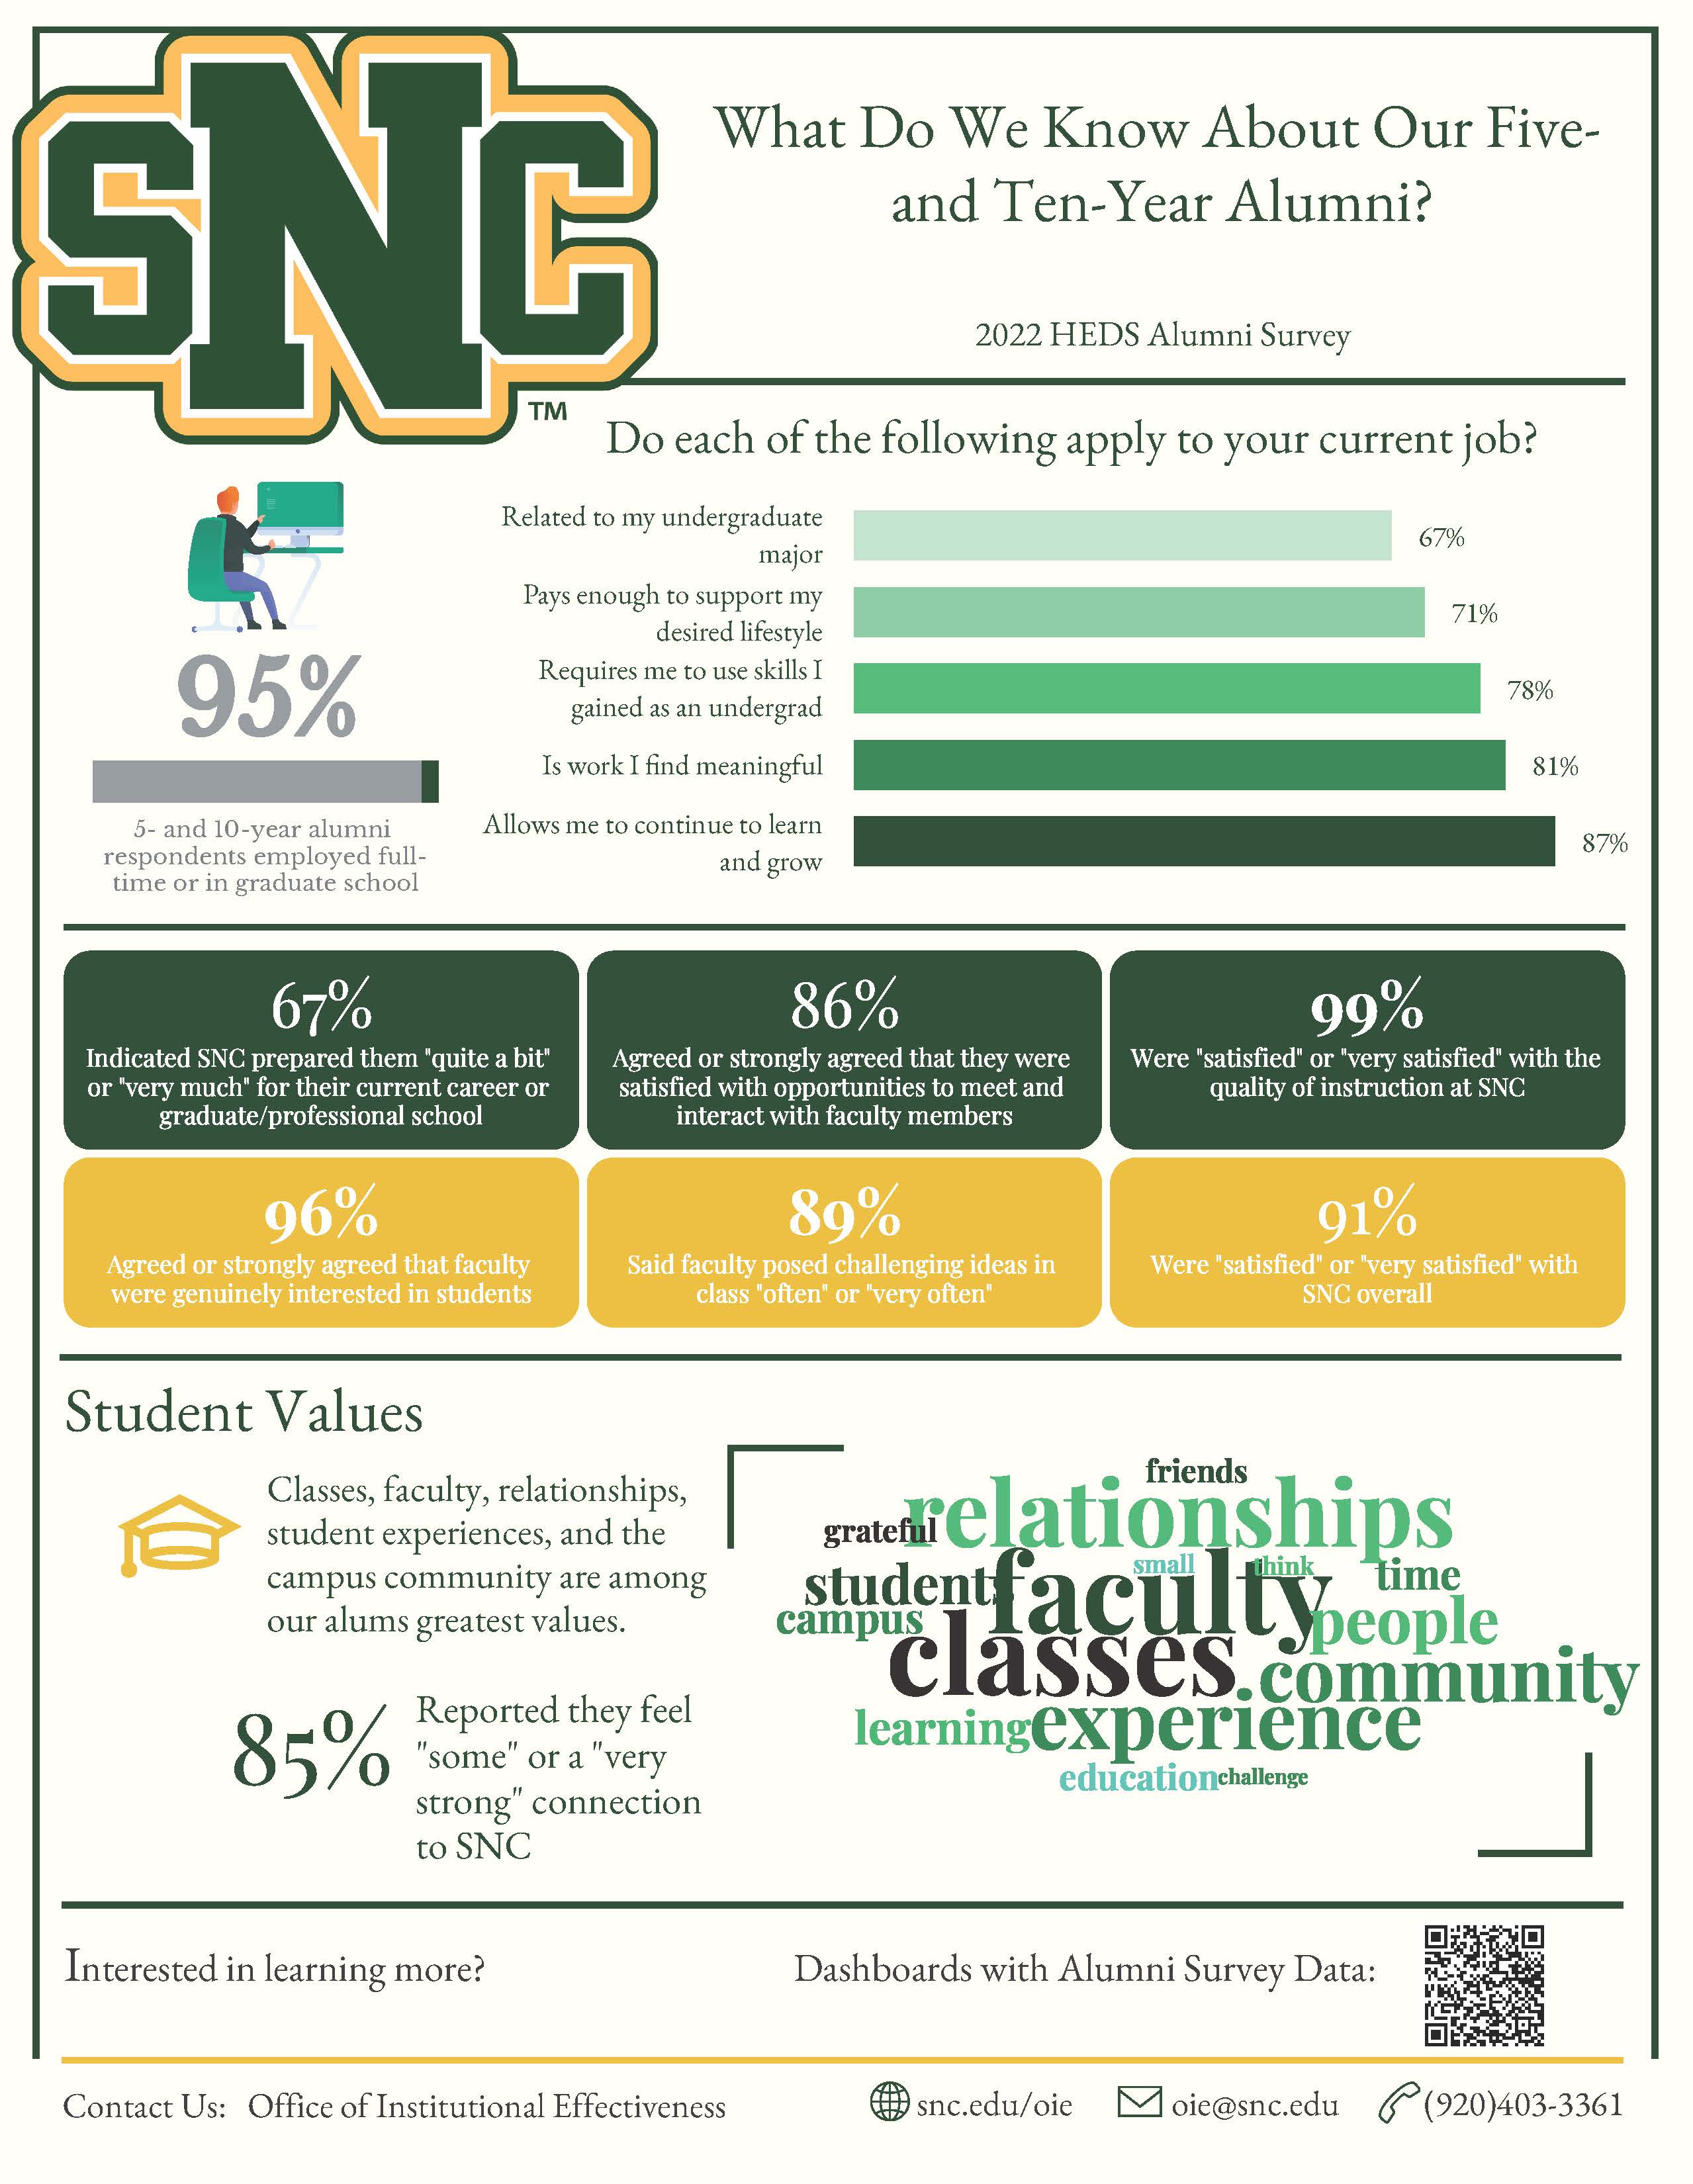 |
2022 HEDS Alumni Survey |
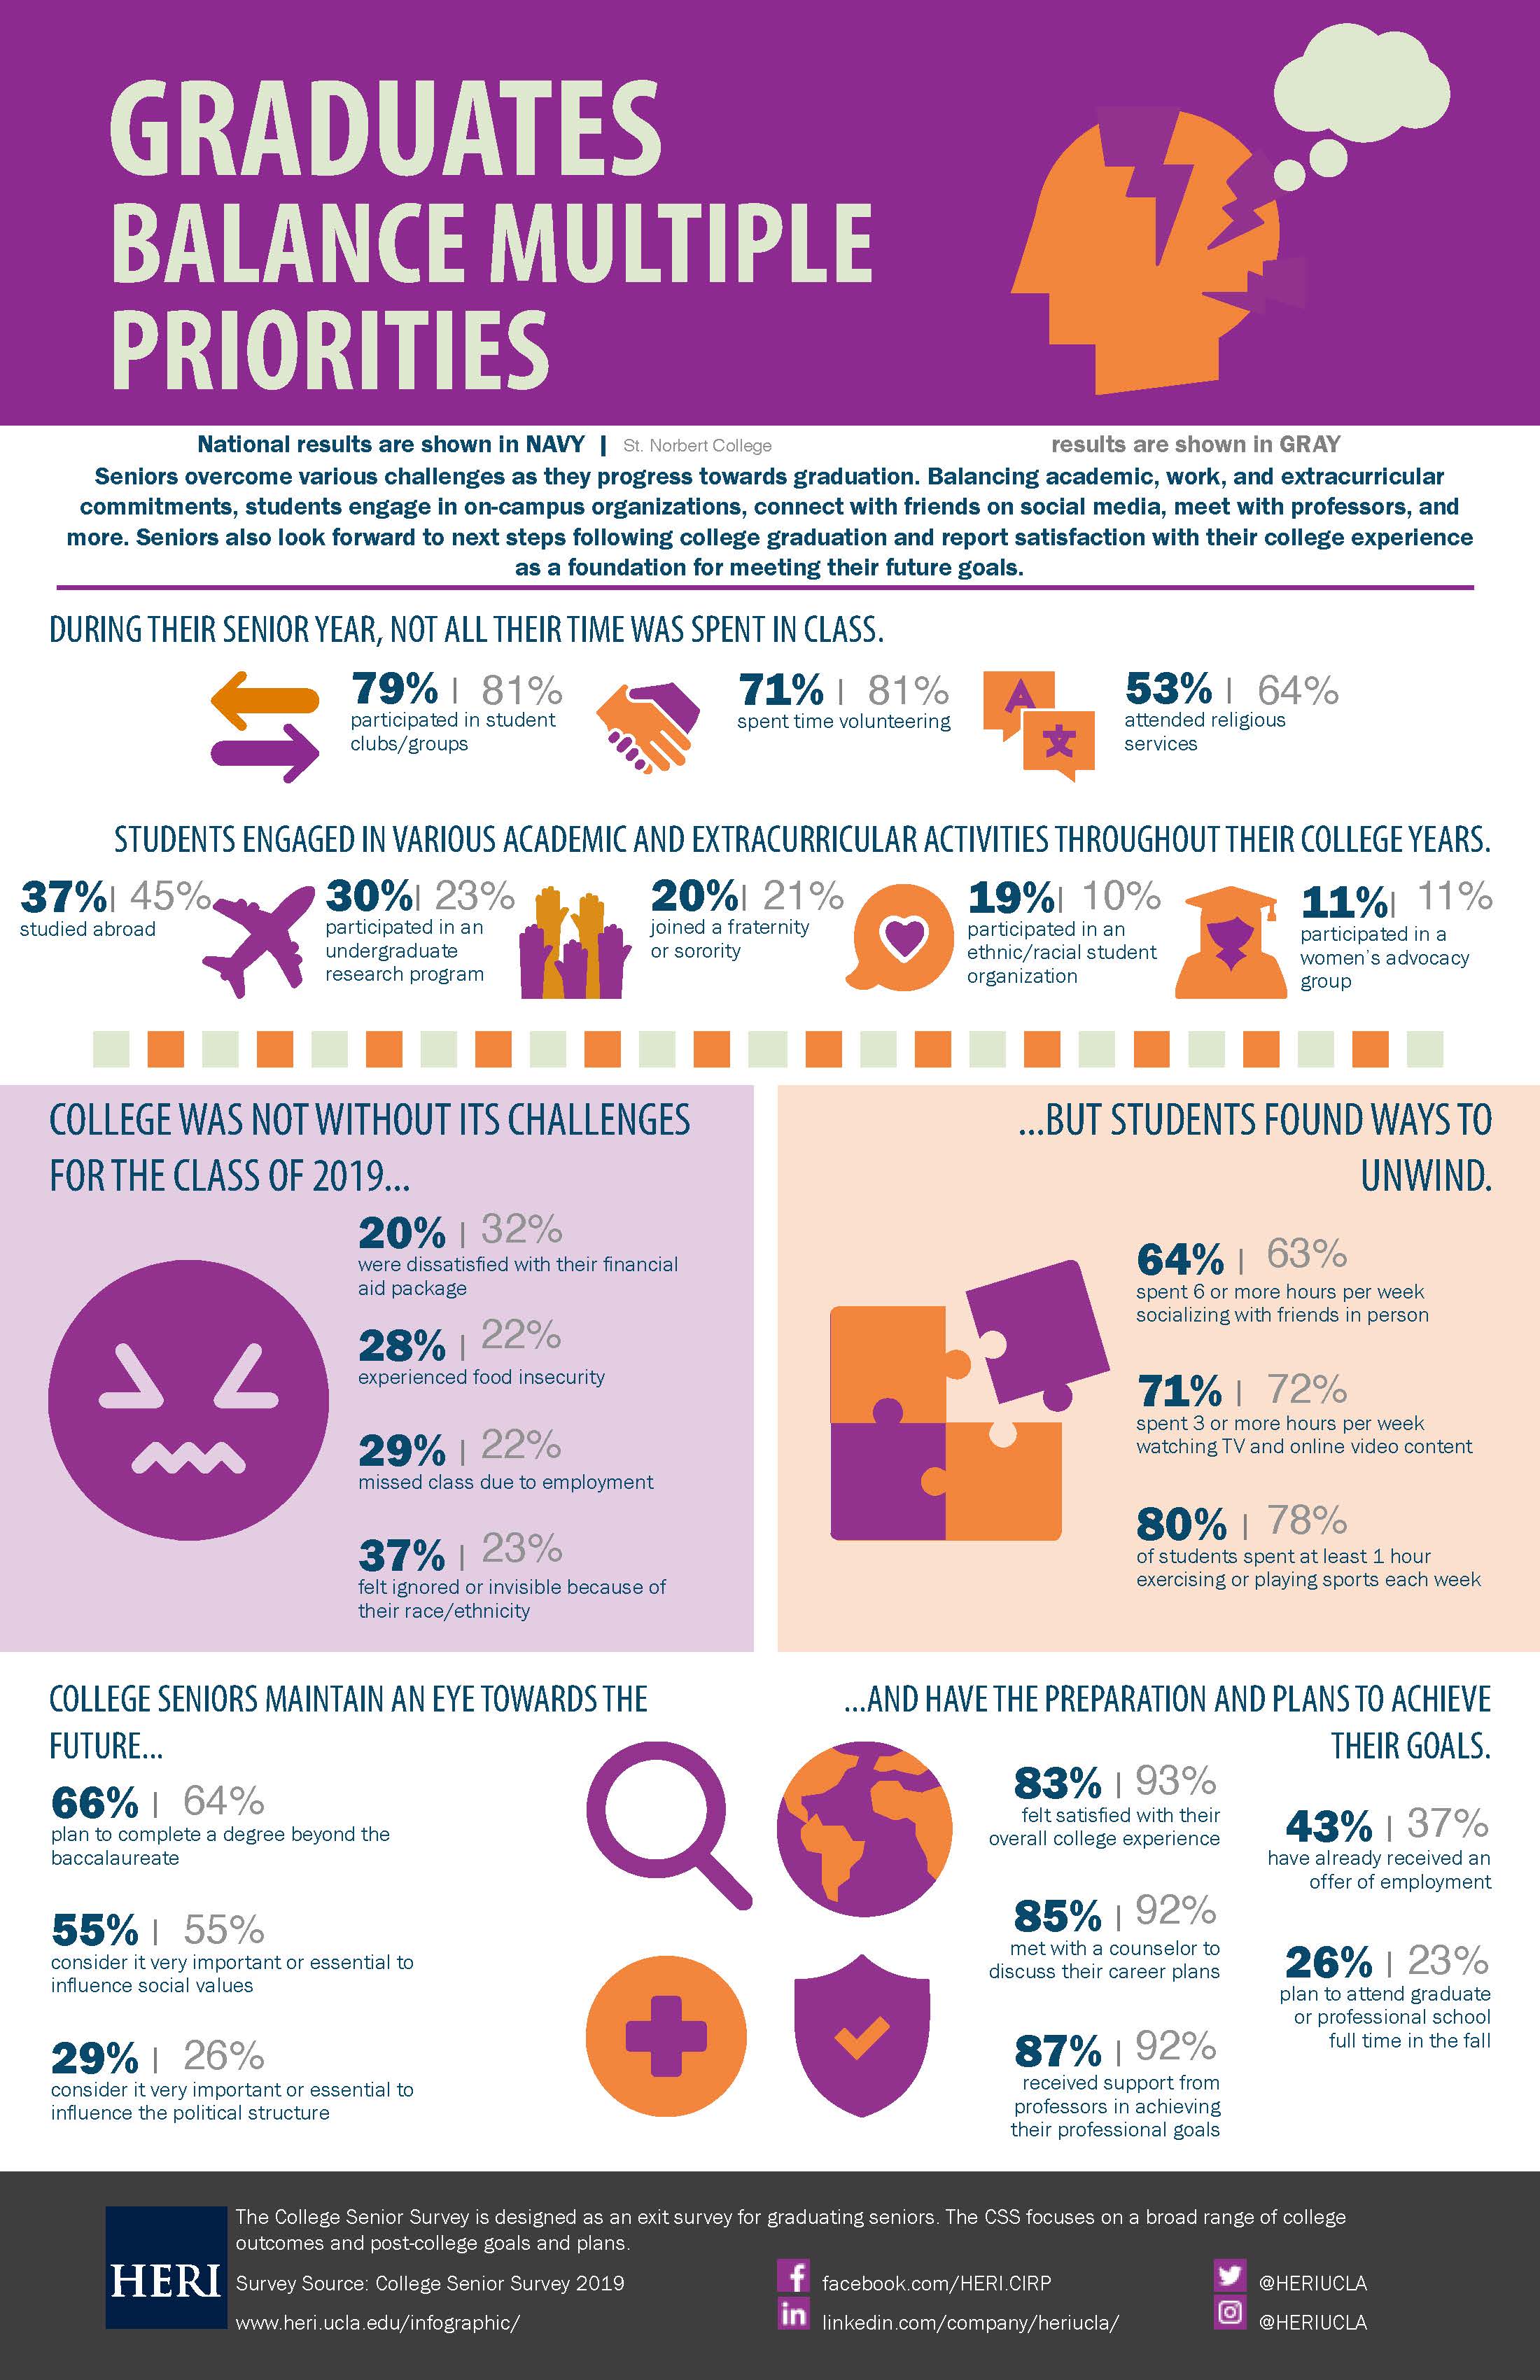 |
Graduating Seniors 2019 "Graduates Balance Multiple Priorities" 2018 "Graduates As Thinkers" 2017 "Working Towards the Future" 2016 “Leaders of the Next Generation” 2015 “Focused on the Future” 2014 Graduating Seniors |
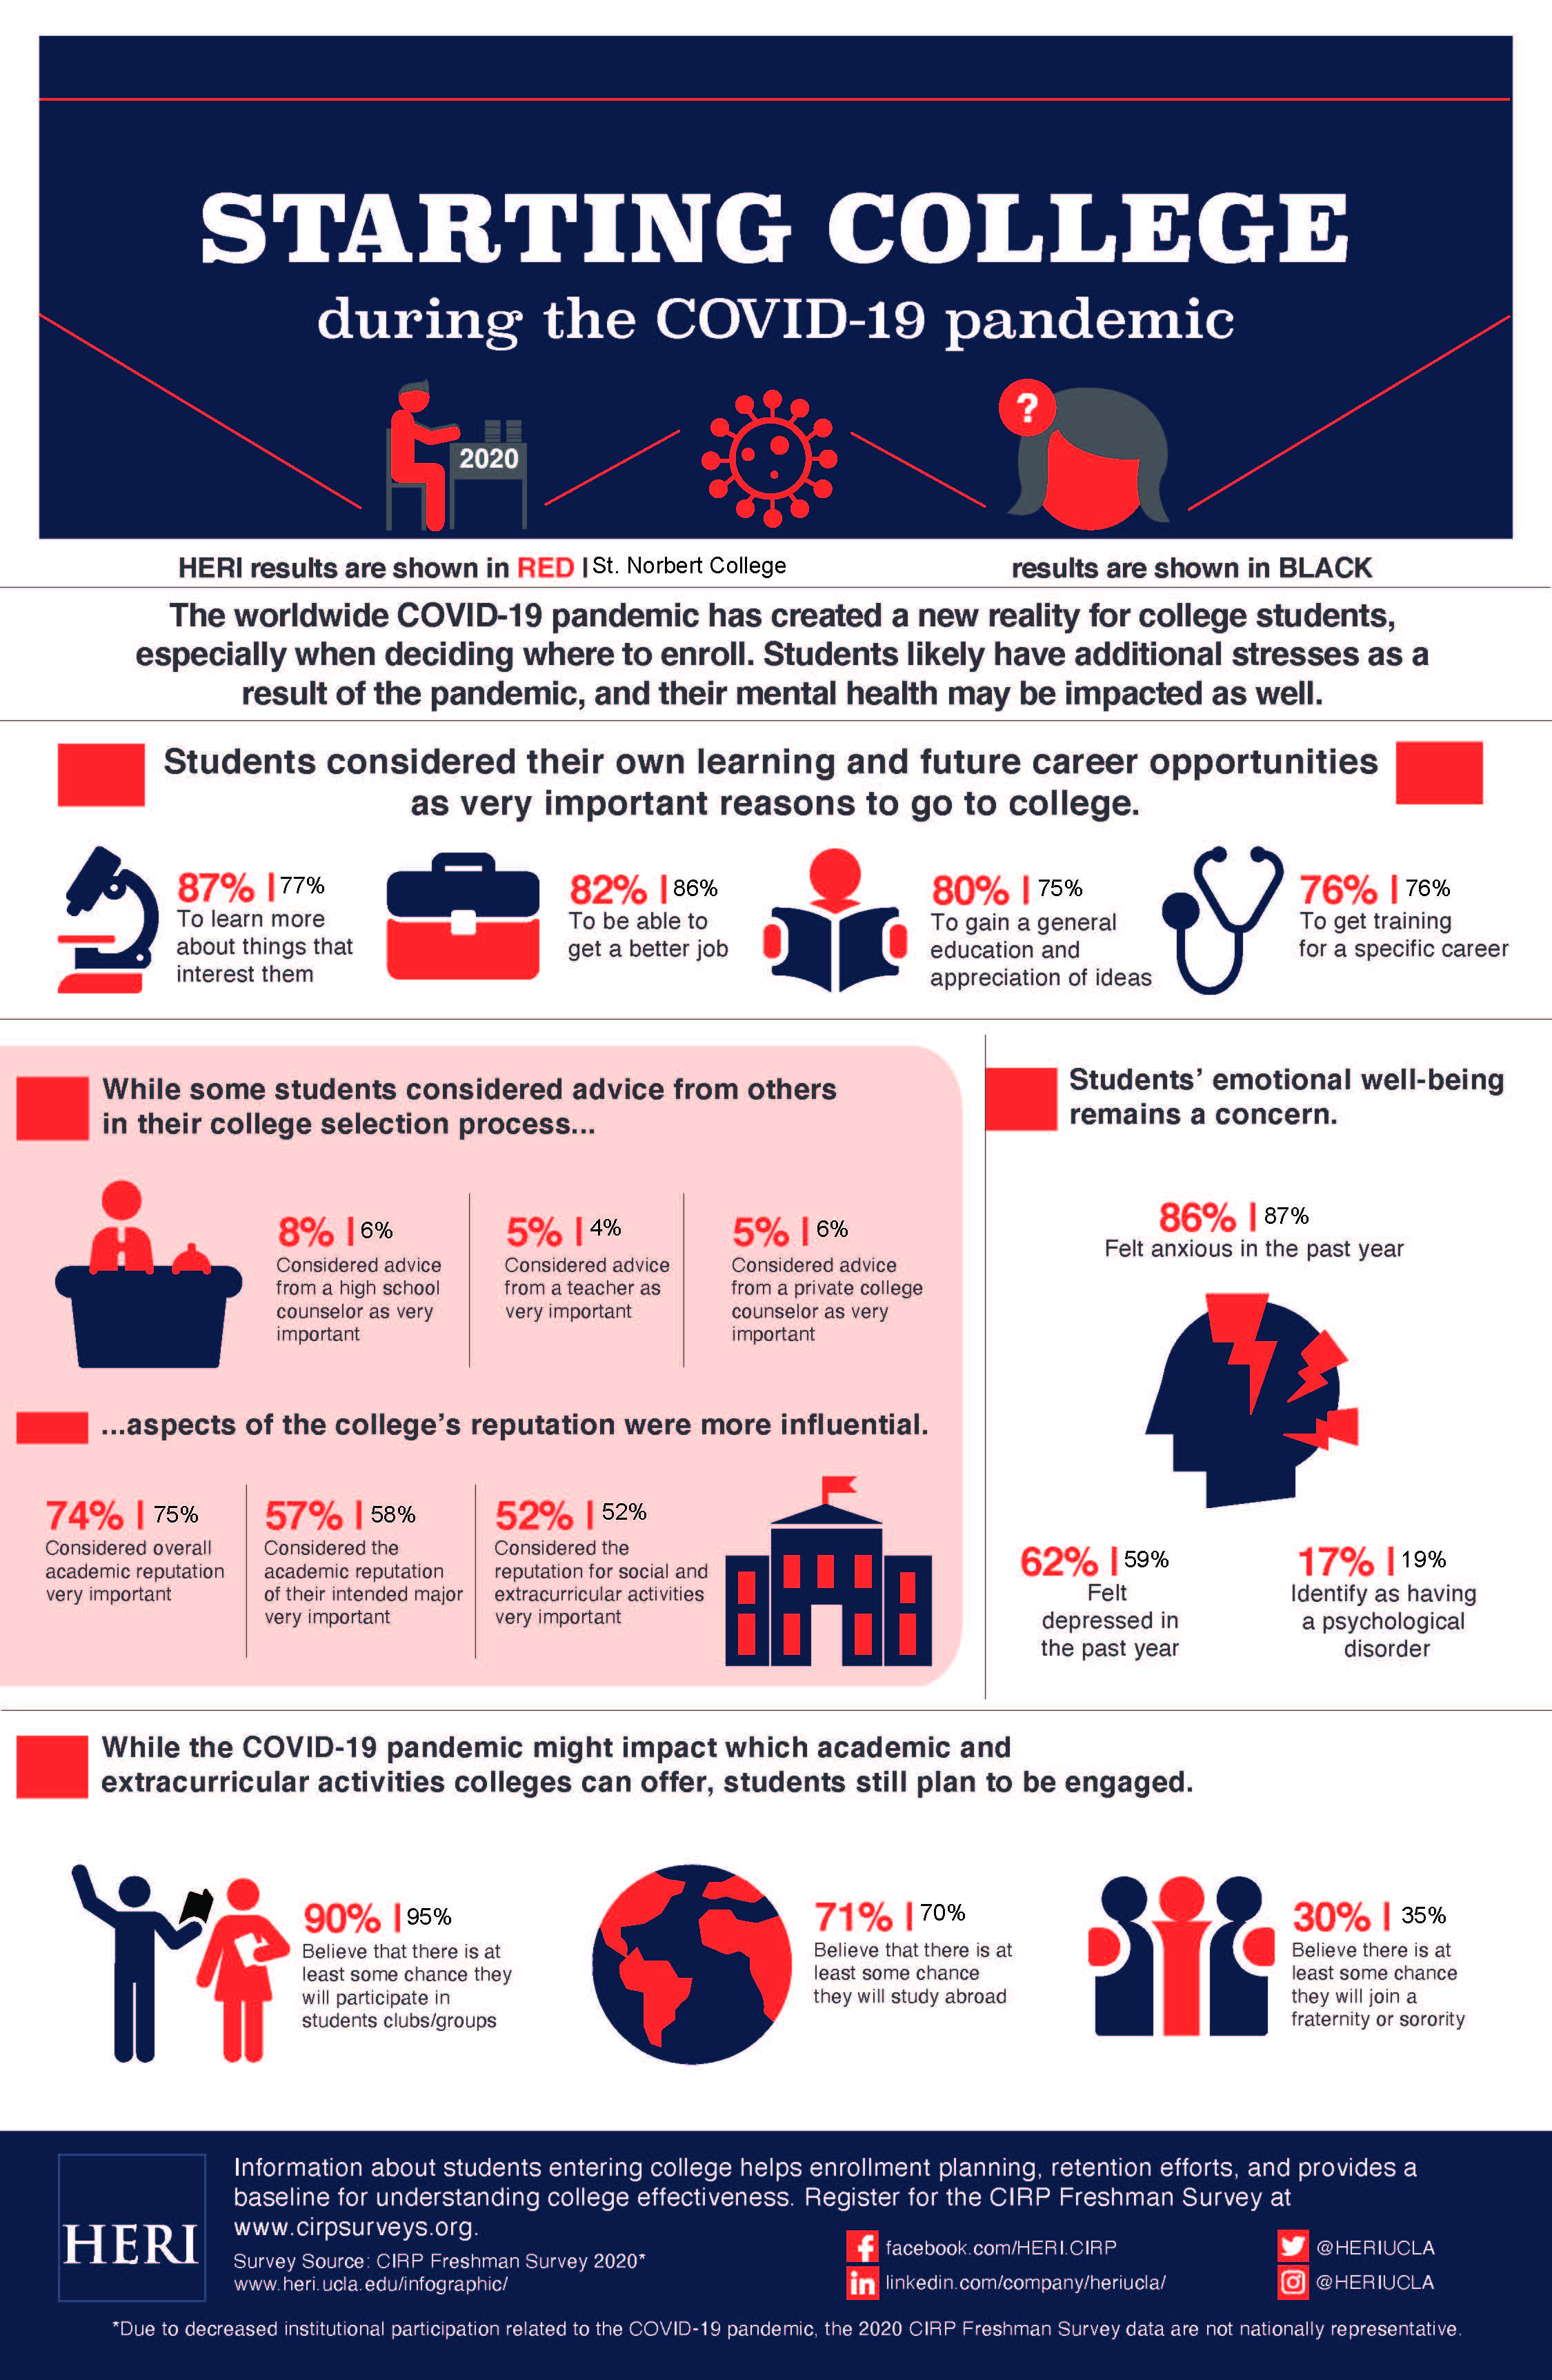 |
First-Year Students 2020 2019 2018 2017 2016 2015 2014 |
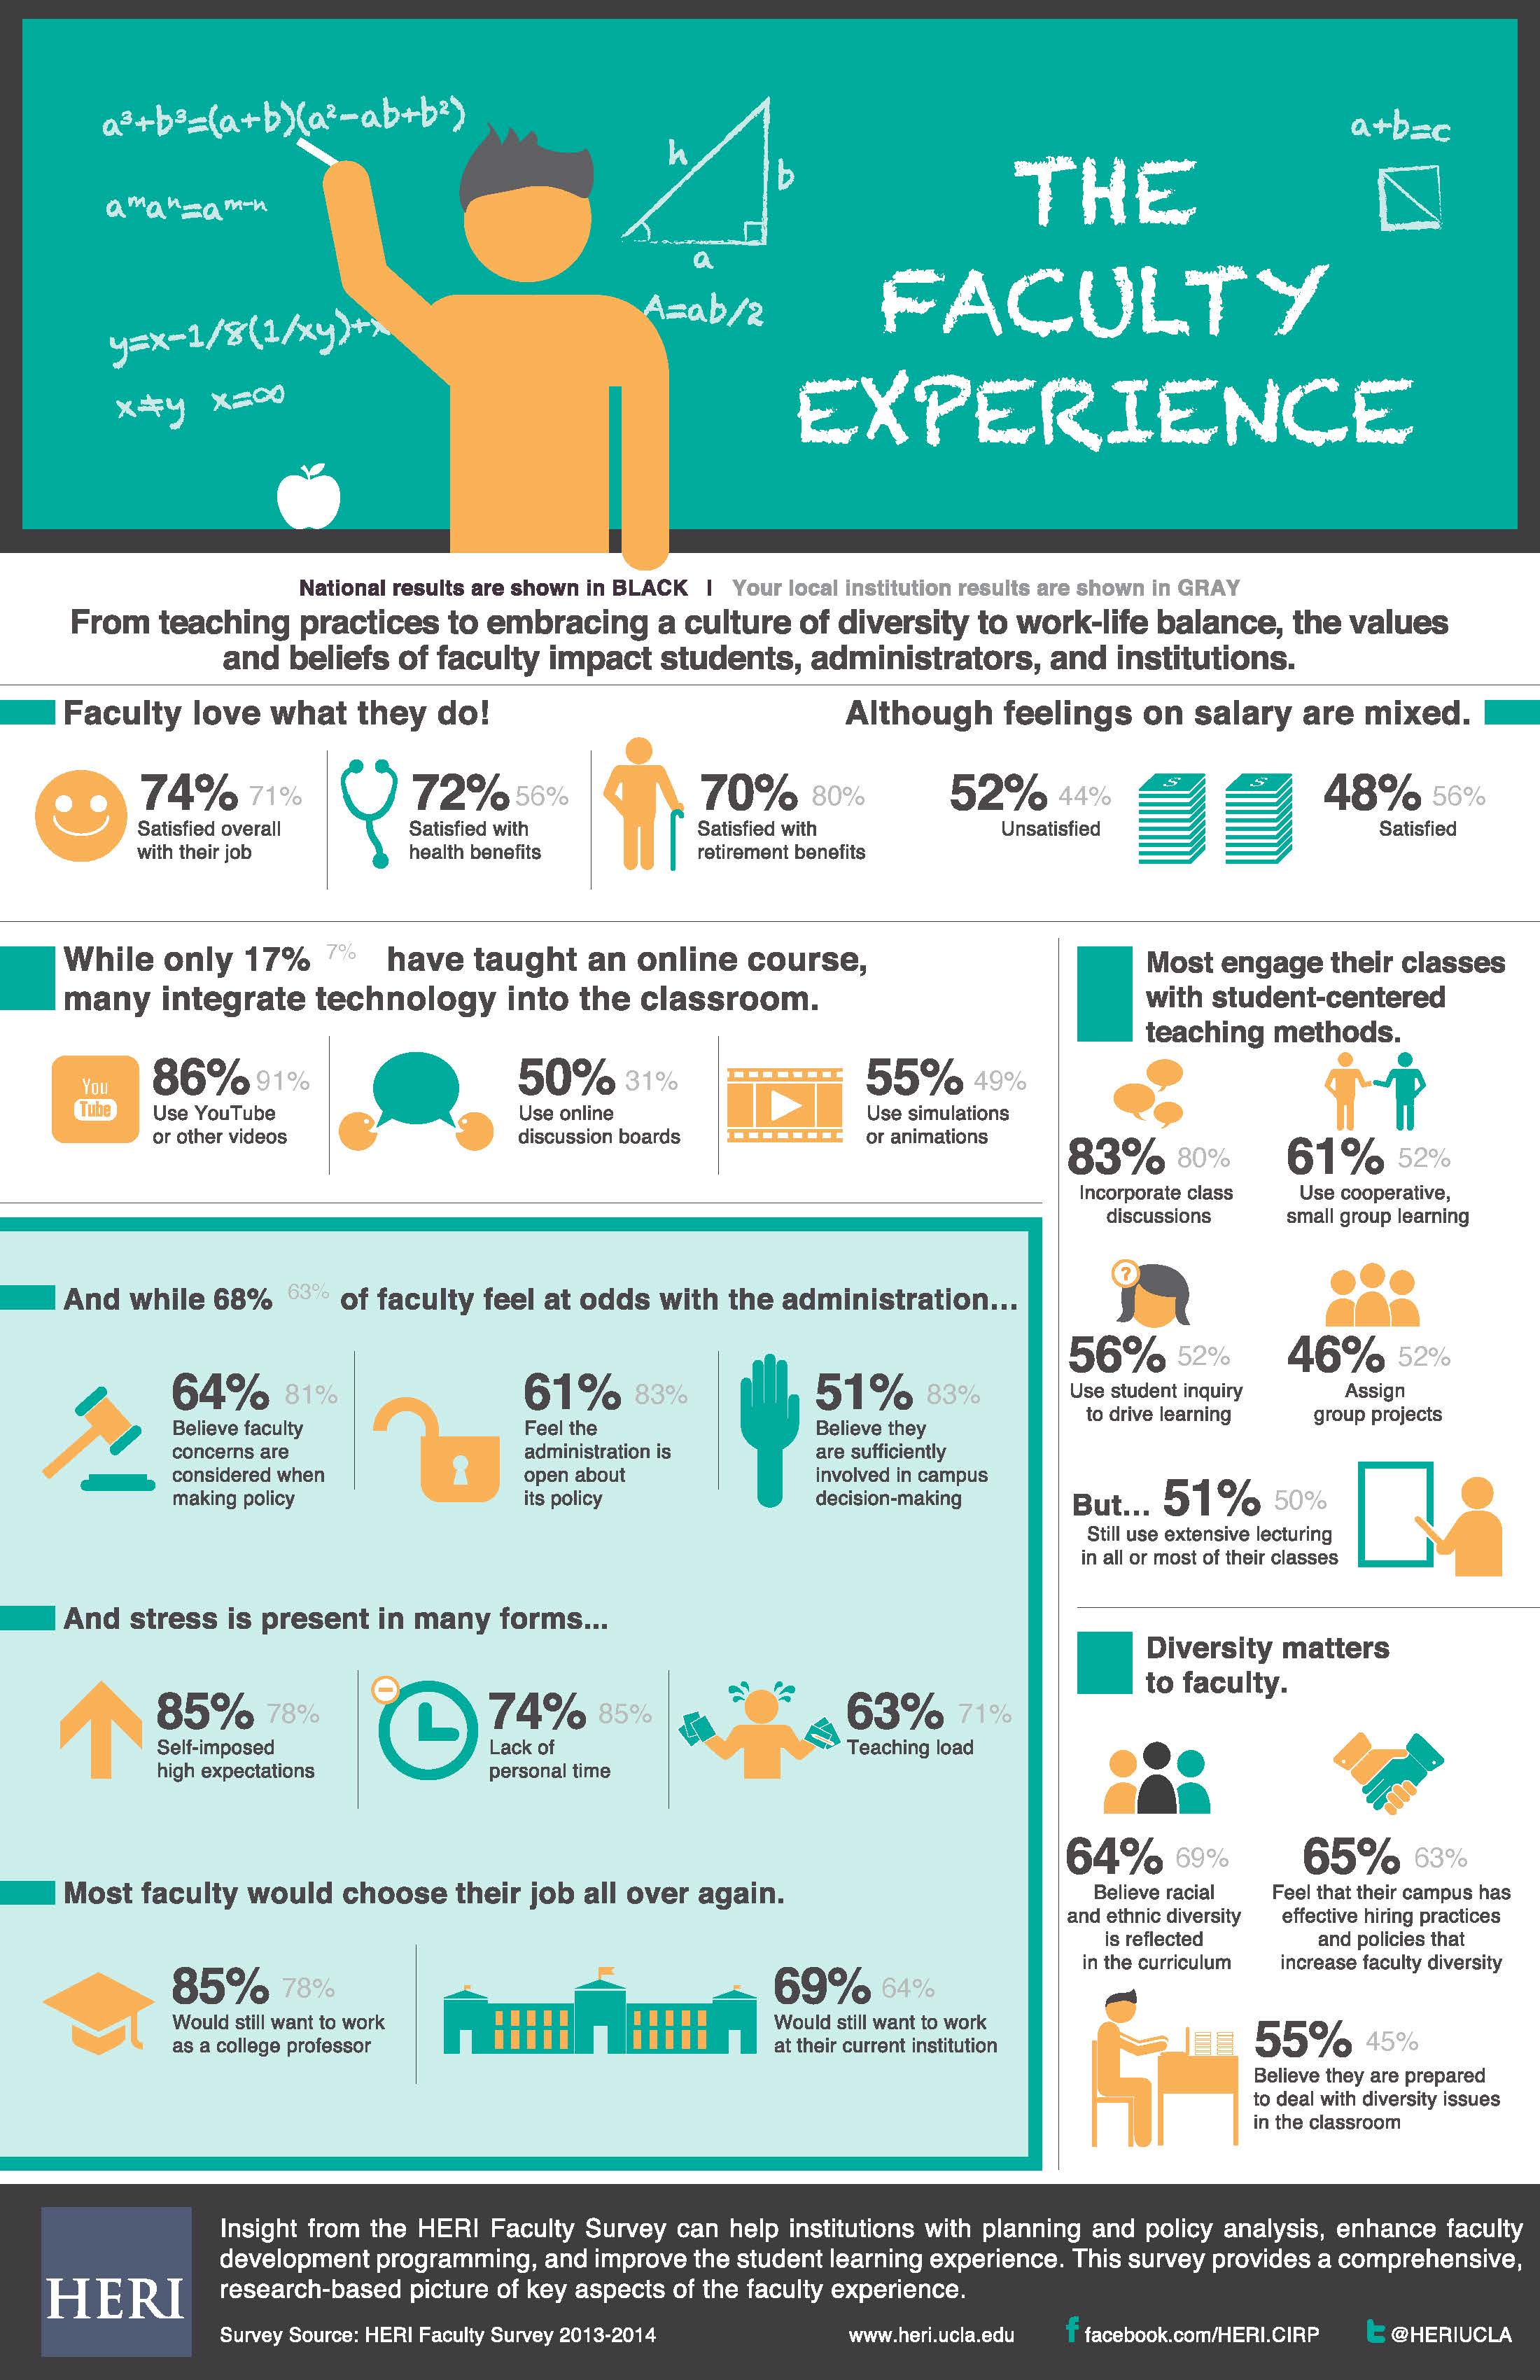 |
Faculty Experience 20142020 |
|
2016 Climate Survey Overall Findings (requires SNC login ID and password) |
Other
These data visualizations were created elsewhere, but some provide information about SNC and all address issues and topics of interest in higher education.
Students
- Background and Beliefs of College First-Year Students
- Where Does Your (Our) First-Year Class Come From?
- Fifty Years of College Students
- Students, by Gender, Race, and Ethnicity, by Institutional Type: Fall 2010 and Fall 2016
- Students: Almanac 2018 (collection of 31 tables and charts)
Faculty
- Race, Ethnicity
and Gender of Full-Time Faculty at more than 3,700 Institutions - Faculty and Staff Salaries at More Than 4,700 Colleges
- The Profession: Almanac 2018 (collection of 22 tables and charts)
States
Interactive Dashboards
|
Census Day Snapshot
Provides aggregate student information as of census day for current and previous academic years. |
|
Enrollment and Retention
Provides information about enrollment and retention trends over time. |
|
Number of Graduates Provides information about graduates of each major program, by year and trend over time, expressed both in terms of actual number and as a percentage of graduates of the division and the college as a whole |
|
Number of Majors/Minors Provides information about numbers of majors and minors for each academic program, by year and trend over time |
|
Course Enrollment Trends Provides information about course enrollments, by year and by term, for each division and discipline |
|
Student Engagement and Experience Provides information about the extent to which students, by |
|
Student Satisfaction Provides information about student satisfaction with various aspects of each academic program, for current students, graduating seniors and alumni. |
|
Student (Self-Reported) Learning Outcomes Provides information about the extent to which students, by |
|
Longitudinal Changes from First-Year to Senior Year This visualization is fascinating but requires a bit more work to digest! It provides a longitudinal look at students who completed both the HERI Freshman and the HERI Senior survey, and shows changes in their “Habits of Mind,” “Academic Self-Concept,” “Social Agency,” and “Social Self-Concept”. |
|
New Graduates' First Destinations Provides information regarding the first destinations of graduating seniors, whether employment, further education, or voluntary service. For those employed, includes name and location of employer, job title, and average salary range. For those pursuing further education, includes name of graduate institution and program. |
Infographics
|
2023 Current Student Survey |
|
Class of 2022: First Destination Survey |
|
2023 HEDS New Student Survey |
|
2021 Global Gen Z Study |
|
2023 HEDS Undergraduate Alumni Survey |
|
2023 HEDS Advanced Degree Alumni Survey |
|
2022 Returning Student Survey |
|
2022 Current Student Survey |
|
Commuting Students at St. Norbert College |
|
2022 HEDS New Student Survey
|
|
2022 HEDS Alumni Survey |
|
Graduating Seniors 2019 "Graduates Balance Multiple Priorities" 2018 "Graduates As Thinkers" 2017 "Working Towards the Future" 2016 “Leaders of the Next Generation” 2015 “Focused on the Future” 2014 Graduating Seniors |
|
First-Year Students 2020 2019 2018 2017 2016 2015 2014 |
|
Faculty Experience 20142020 |
|
2016 Climate Survey Overall Findings (requires SNC login ID and password) |
Other
These data visualizations were created elsewhere, but some provide information about SNC and all address issues and topics of interest in higher education.
Students
- Background and Beliefs of College First-Year Students
- Where Does Your (Our) First-Year Class Come From?
- Fifty Years of College Students
- Students, by Gender, Race, and Ethnicity, by Institutional Type: Fall 2010 and Fall 2016
- Students: Almanac 2018 (collection of 31 tables and charts)
Faculty
- Race, Ethnicity
and Gender of Full-Time Faculty at more than 3,700 Institutions - Faculty and Staff Salaries at More Than 4,700 Colleges
- The Profession: Almanac 2018 (collection of 22 tables and charts)
States
Contact Us
Phone: 920-403-3361
Email: oie@snc.edu
© 2025 St. Norbert College | Nondiscrimination Policy | Land Acknowledgement | Privacy Statement | Site Accessibility | Title IX


